

Performance Analytics is a solution for collecting and analysing data. It provides tracking, aggregating, and visualising key performance indicators over time, so everyone involved knows how the process is performing.
It has rich sets of possibilities on how to configure indicators (KPI) and how to visualise.
ITSM processes in ServiceNow
The aim of ITSM is to manage access and availability of services, fulfil service requests coming from end-users, and provide a single cloud-based interface.
The key ITSM processes/pillars are:
- Incident management: restores services and resolves issues quickly.
- Problem management: identifies the root-cause of an issue in the IT service, reported as occurring incidents.
- Change and release management: prioritising, approval, scheduling, and execution of changes to IT systems (software, hardware).
- Request management: addresses service requests from customers, employees.
- Knowledge management: enables the sharing of information in knowledge bases.
- Configuration management: builds logical representations of assets, services, and the relationships between them.
To be able to measure process performance, we have Performance Analytics (PA), which collects and visualises data in the dashboards.
PA for ITSM and available content packs
Each ITSM process has a content pack, which is a collection of predefined dashboards, visualisations, indicators (KPI). There are content packs for Change Management, Problem Management, Incident SLA Management, and many others. They are distributed by plugins, and it is possible to install them as a package.
You get a nice solution for process monitoring with low effort. If your ServiceNow implementation is out-of-the-box, it is easy to use: simply install the plugin and activate the collection jobs.
Steps to activate ITSM Dashboards
Before we begin, an important note: make sure to proceed through these steps as an admin.
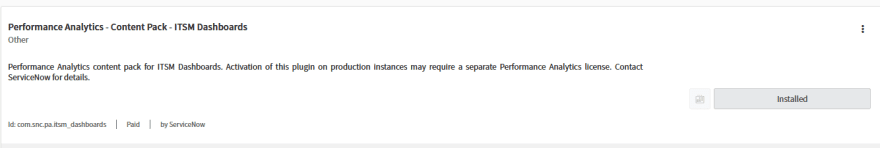
- Plugin activation: Content Pack – ITSM Dashboards (com.snc.pa.itsm_dashboards) [see picture 1.1]
- Set dashboard permissions:
- Navigate to Performance Analytics > Dashboards
- Search for the following dashboards:
- IT Executive dashboard
- IT Manager dashboard
- IT Agent dashboard
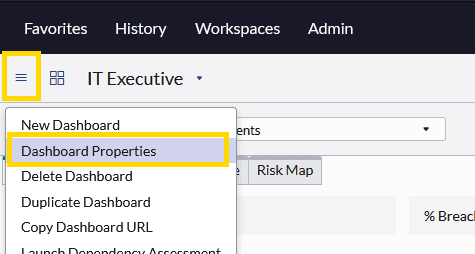
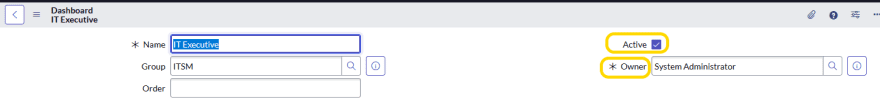
- Follow the steps to active and set sharing options for each of these three dashboards [see picture 2.1]
- Set Active and Owner and Update [see picture 2.2]
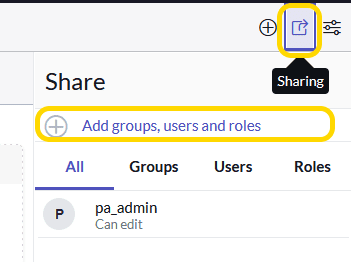
- Go back to the dashboard and use Sharing on the top right. Add groups, users and roles, which should be able to access the dashboard [see picture 2.3]
- Dashboard setup is complete, however, one more step is needed
- Enable performance analytics data collection jobs: Performance Analytics do not use real-time data, but it stores data in dedicated data tables. It allows for using complex aggregation operations and stores lots of data with minimum impact on instance performance. By default, the collection jobs are inactive, so the admin should activate them.
- There are two types of PA collections jobs:
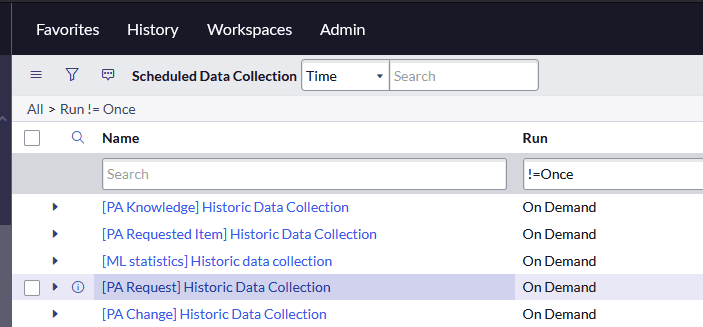
- Historic: it is usually run only once when the plugin is activated, and it collects historical scores in defined periods. You can find them easily: name contains historic and Run is On Demand. The job is not run automatically, the admin should perform it. It is important to note that running a historic collection job will rewrite existing scores. So it is recommended to run it just once. [see picture 3.1]
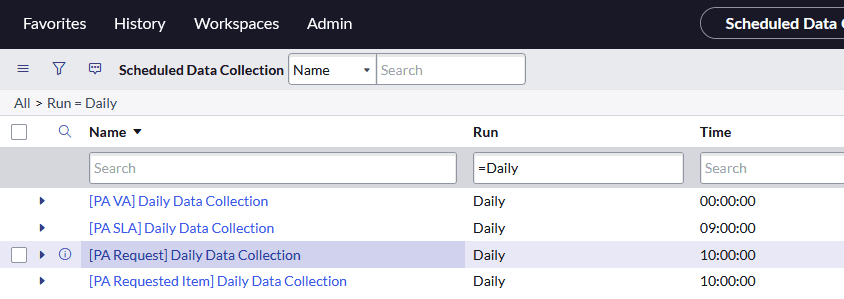
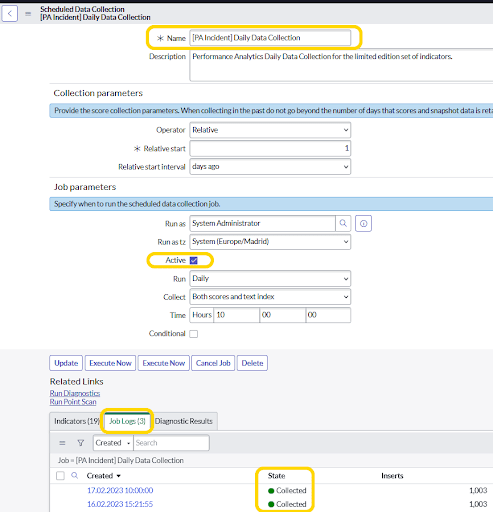
- Daily: it collects data on a daily basis and needs to be activated by admin (it is inactive after plugin activation). [see picture 3.2]
- Navigate to Performance Analytics > Data Collector > Jobs and look for ITSM related daily collection jobs. For example: [PA Incident] Daily Data Collection, [PA Incident SLA] Daily Data Collection for Incident, similar for Problem management [PA Problem] Daily Data Collection, [PA KM] Daily Data Collection etc. for other processes. Open collection job and, check Active, Run as must be existing admin user and click Execute Now.
- In Job logs related list you will see data collection status and if any error occurs with details. Now it will automatically run daily at specified time and will collect data. [see picture 3.3]
- Do the same for other ITSM related collection jobs.
- There are two types of PA collections jobs:
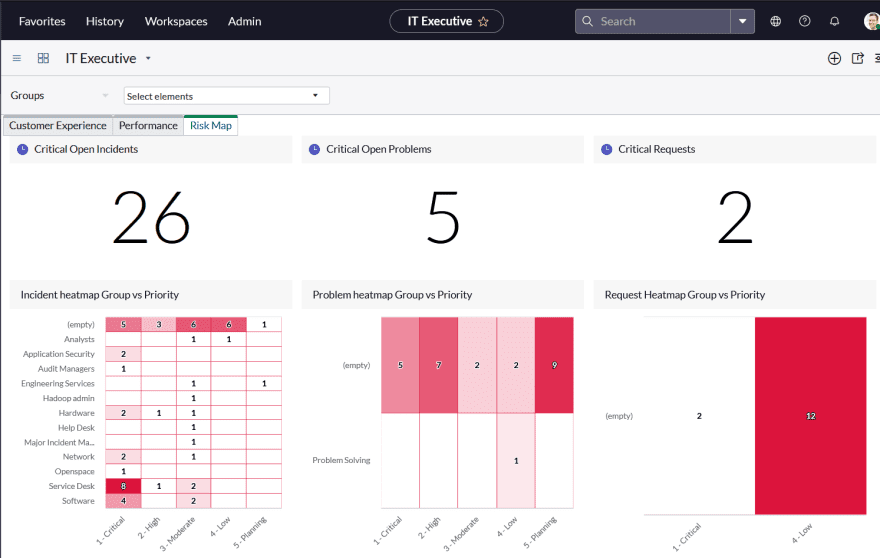
IT Executive dashboard
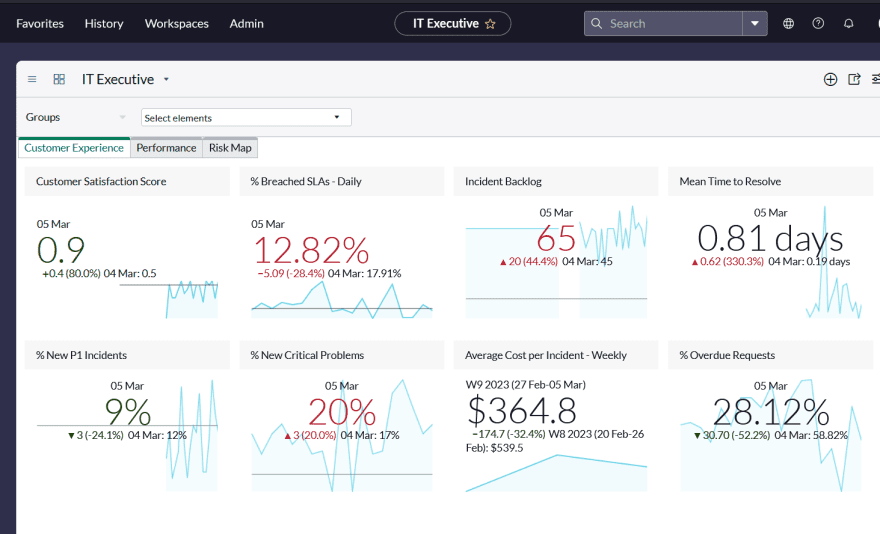
This dashboard provides a high-level view across all ITSM processes and is intended to be used on an executive level. There are KPIs such as: % of new critical incidents, Active Breached SLAs Today, Average reassignment of open incidents, % of overdue requested items.
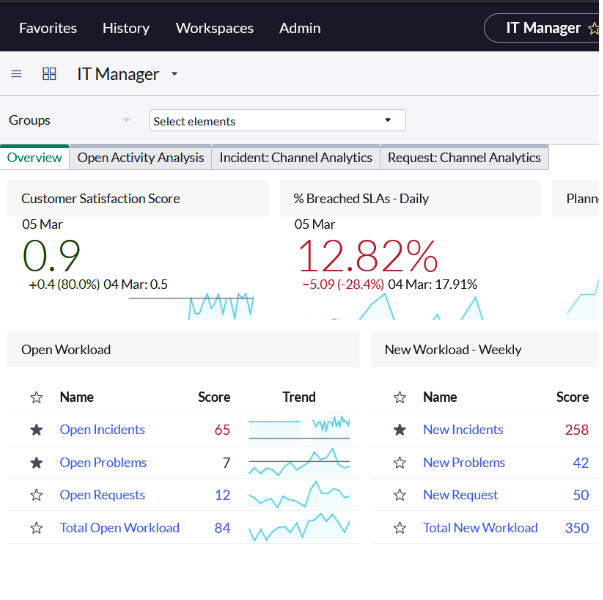
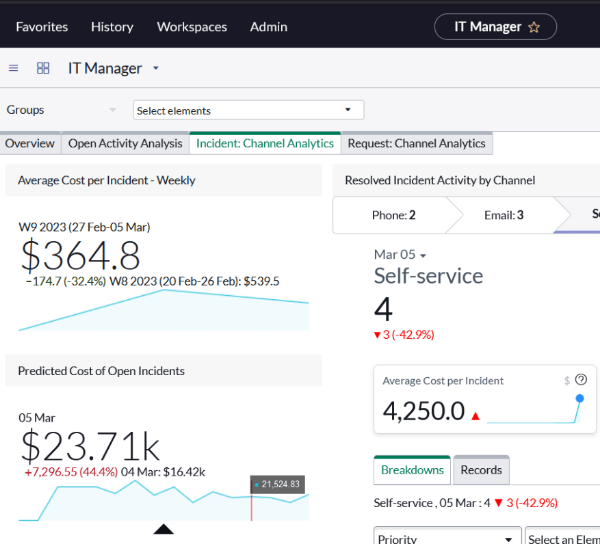
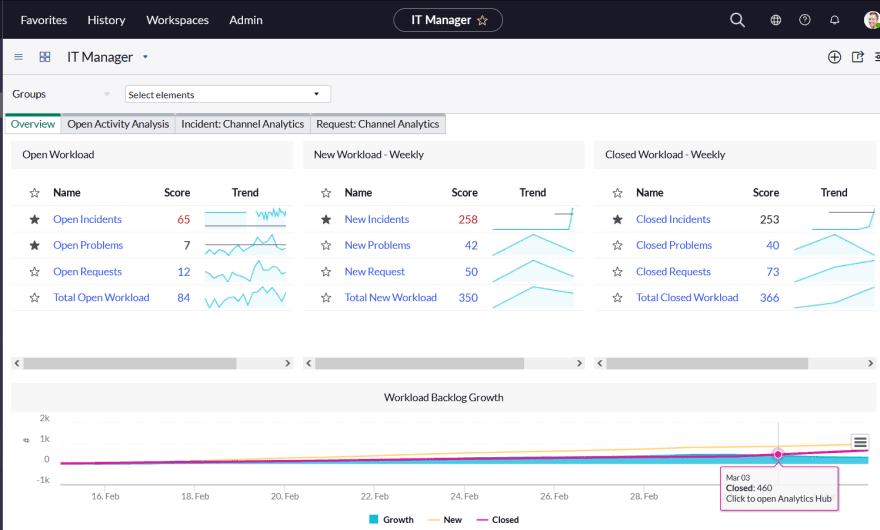
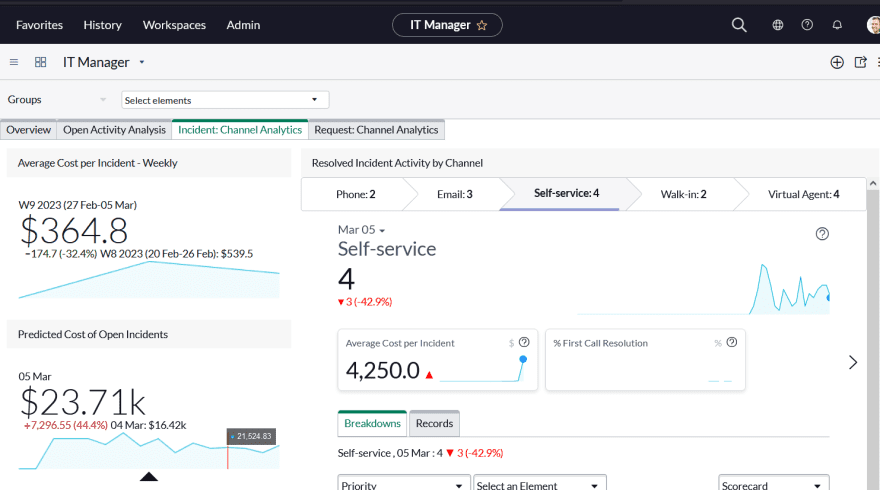
IT Manager dashboard
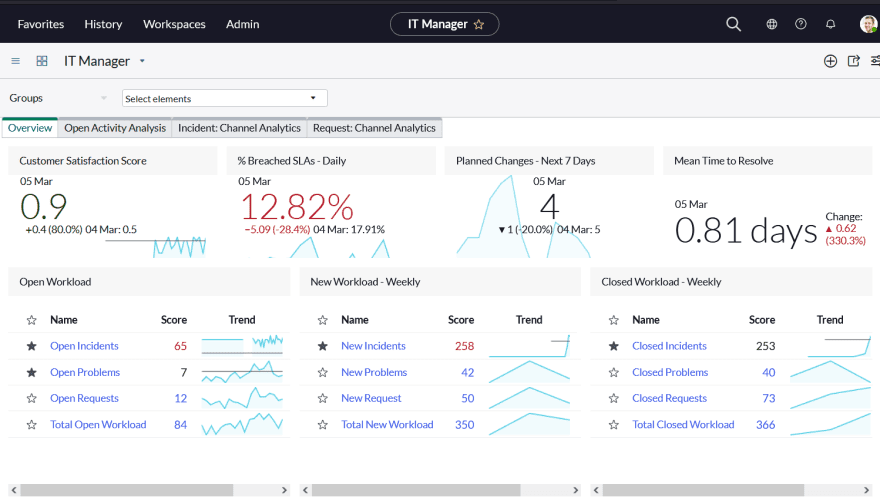
The aim of this dashboard is to present data on a group manager level. It shows important metrics on a daily and weekly basis for incidents, problems, and requests. Metrics are filterable by group. KPIs such as Customer satisfaction score, % Breached SLAs, Open / New / Closed workload, Workload backlog growth, Average cost per resolved incident are available.
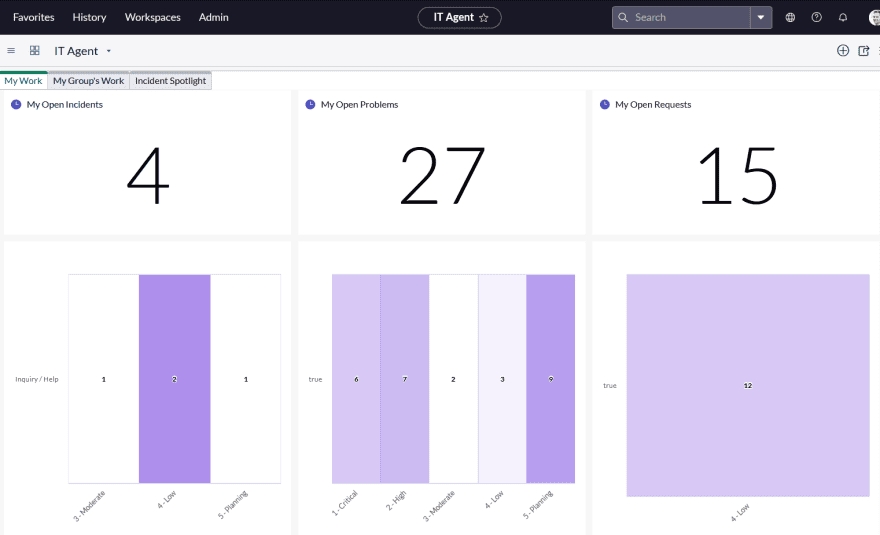
IT Agent dashboard
The final dashboard shows open incidents, problems, and requests that belong to you and your assignment groups. It is intended to be used on an operational daily basis by agents.
Conclusion
Almost every process has its own Performance Analytics content pack with predefined dashboards, metrics, visualisations (e.g. ITSM, CSM, GRC, SecOps, ITOM, …) and they are ready to be used with minimum effort.
Content packs are built on out-of-the-box processes. When the process is changed e.g. changing any field, modified states it might be needed to reflect the change also on PA level and additional development work is needed.
You can also create your own metrics, however it is a paid feature and additional licences might be required. In order to discover the added value Performance Analytics can bring to you and your business, don’t hesitate to reach out to us and we will gladly get in touch with you.

Certified ServiceNow Experts at your service
ServiceNow can empower your employees and clients with digitalized workflows, and Devoteam, as the #1 preferred Partner in the EMEA, is eager and ready to help make your digital transformation journey a success. Ready to see what we can bring to the table?

